
A plain guide to patterns that describe what gold did, not what it will do.
Gold is the market this site draws on. This site teaches the candlestick and chart patterns that show up on gold's own price history, each drawn on a real stretch of that history. Every pattern is explained in plain words: a shape on a chart is a record of the past, not a promise about the future.
Each page takes one pattern, defines it exactly, and shows it on a real stretch of gold's price history.
Learn what a marubozu, a tweezer top, or a three soldiers run tells you about the session it formed in.
See why a pattern describes what gold has already done, and why that is not a forecast of what it will do next.
What each pattern shows on gold
- Weekend gapThe space between Friday's last price and the first price after the market reopens, and what it says about news that landed while gold was shut.
- Bear flagA sharp fall, a short drift up, and the textbook expectation of a break back down—and how to tell it from the start of a recovery.
- Rectangle rangePrice bouncing between a flat floor and a flat ceiling, and why the first break of that range is often a false one.
- MarubozuA candle with a full body and little or no shadow, meaning the market opened at one extreme and closed at the other.
- Tweezer tops and bottomsTwo consecutive candles with the same high at the end of a rise, or the same low at the end of a fall—a level the market refused twice.
- Three soldiers and crowsThree long candles in a row in one direction, each opening within the previous body and closing near its extreme.
How a page of this site is built
Each pattern page opens with a chart drawn from real daily bars, directly under the heading. A candle that closed above its open is hollow and one that closed below is filled; the pale band is the figure; dashed lines are the lines the definition uses, the floor and ceiling of a rectangle or the lines of a flag; and a labelled circle is a point the rule used. Under the chart a caption names the instrument, the source and the date the history was read.
Below the chart the page defines the pattern in plain words, then repeats the definition in the rule's own numbers, then says what the pattern cannot tell a reader. A count follows: how many times the rule found the model in ten years on the two gold series. Nothing on a page is a signal and no page promises what gold will do next. One page ends with a finding instead of a chart, and the reason is given there.
Two gold series, both in dollars
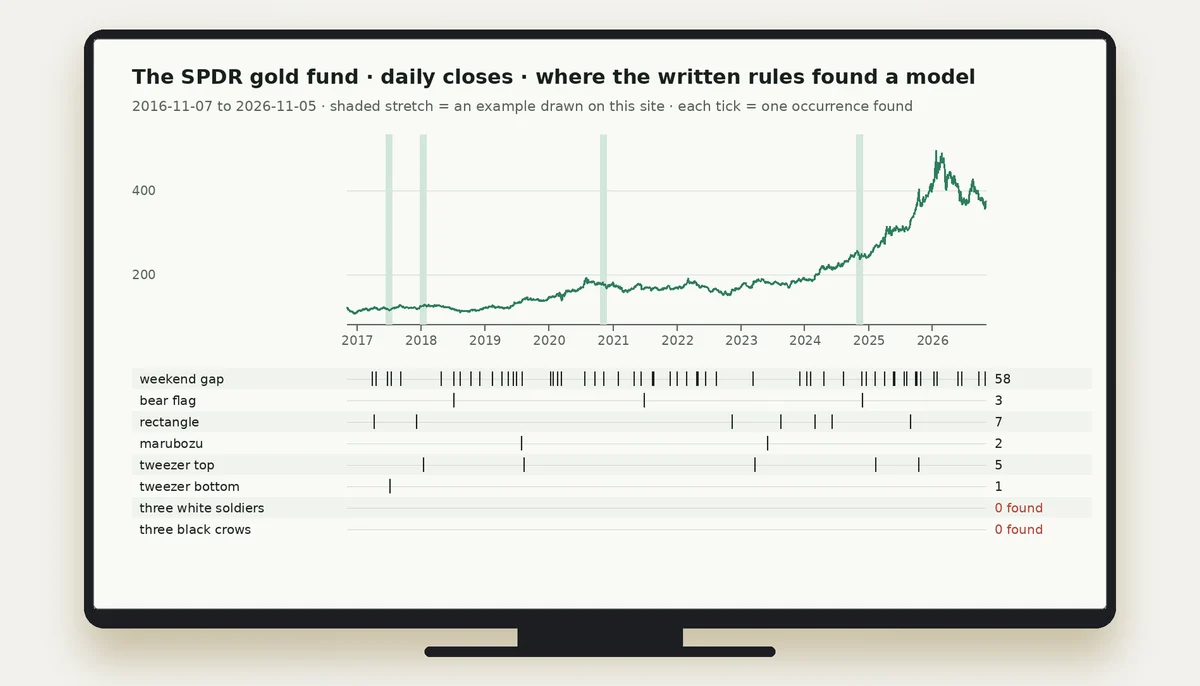
The history behind the site is two series. The first is COMEX gold futures (GC=F), priced in dollars per troy ounce, 2,437 daily bars after cleaning. The second is the SPDR gold fund (GLD), a fund listed on a stock exchange and priced in dollars per share, 2,513 bars. Both run from 7 November 2016 to 5 November 2026 and were read once, on 6 November 2026.
They are different objects. A futures contract and a listed fund follow the same metal but print different bars, which is why a rule can find a pattern often on one and rarely on the other. The site draws no rupee price. A chart in rupees would mix the move in gold with the move in the exchange rate, and the patterns here are meant to describe gold itself. Each chart says which of the two it is drawn on.
Eight models, eight written rules
The site covers the weekend gap, the bear flag, the rectangle, the marubozu, the tweezer top, the tweezer bottom, the three white soldiers and the three black crows. Each has a rule written before the search. The gap needs a Monday open at least 1 ATR from Friday's close. The bear flag needs a pole of at least 8 ATR within 15 sessions and a flag of 5 to 20 sessions that gives back 10 to 50 percent of it. The rectangle needs two highs and two lows within 1 ATR of each other and a box at least 3 ATR high.
The marubozu needs a candle of at least 1.5 ATR with a body of at least 95 percent of the range. The tweezers need two candles whose highs or lows differ by at most 0.1 ATR. The soldiers and the crows need three candles of at least 0.6 ATR each with strict opening and shadow conditions. ATR is the average true range of the last 14 sessions, and a rule written in ATR means the same thing in a calm year and a wild one.
What the counts say
In ten years the rules found 64 weekend gaps (6 on futures, 58 on the fund), 3 bear flags (all on the fund), 14 rectangles (7 and 7), 21 marubozu candles (19 on futures, 2 on the fund), 7 tweezer tops and 2 tweezer bottoms, and no soldiers and no crows on either series.
The spread is itself informative. A gap of a full ATR is a visible event but there were 64 of them; a bear flag, which needs a violent fall followed by a gentle recovery, appeared three times in a decade. The counts say how demanding each definition is on these two series. They do not rank the patterns, they say nothing about how often a pattern was followed by a move, and they would change with other instruments or other thresholds. The fund and the futures follow the same metal, so the counts are not independent either.
Why a pattern counts only when a close completes it
A candle that is still trading is not yet a candle. A session that looks like a marubozu at midday can end with a long shadow, and a break through a flag's lower line can reverse by the close. For that reason every rule counts a model as formed at a close: the last candle's close for a candle model, a close below the flag's lower line within 3 sessions of the last flag bar, a close outside the box of a rectangle within 25 sessions of the last pivot.
The session on which the rule was satisfied is marked on the chart, and the chart stops there or shortly after. Nothing drawn after that session was used to decide anything. A reader who finds a pattern on a live chart and acts before the close is acting on something that may not exist at the close, and the school of mistakes this site teaches against starts there.
The page with no chart
The page about the three white soldiers and three black crows has no chart. Rules 3W-1 and 3W-2 were run over every bar of both series and found no occurrence in ten years. The site could have loosened the rules until an example appeared, or borrowed one from another market, and either would have put a chart on the page. Neither would have been honest.
The finding is narrow. It says that these rules, written in advance, produced zero on gold futures and the gold fund. It does not say that three long candles in a row never happen on gold, and it does not say they mean nothing. Readers who remember such runs on a chart remember a looser shape than the one defined here, and the page shows the difference between a shape recalled and a rule applied.
Bars with no range
The source sometimes prints a bar whose high equals its low: an exchange holiday or a day with a single price. Such a bar carries no session. Left in, it would pass for an inside bar or sit as a flat neighbour beside real candles and would pull down the ATR that every threshold uses. Before any rule runs, these bars are removed from the stored history.
On the gold futures 77 bars were removed in this way, which is why the futures series has 2,437 bars against 2,514 stored. On the fund none were removed. The step is the same for every rule and happens before any count, so it cannot favour a result. A reader who lines up a futures chart here with a platform's chart may find a date missing; the stored history shows no trading range on it.
What a drawn example leaves out
A chart shows one occurrence, the cleanest by the rule's own measure when there are several. It leaves out what happened next in any way that could be counted, because counting outcomes needs a definition of success, and this site publishes none. It leaves out volume, because the stored history holds only open, high, low and close. It leaves out every time frame except the daily one, and every instrument except these two.
These omissions are stated where they apply. A reader who wants to know how often a flag was followed by a fall, or how often a gap closed, would need a counting definition and far more occurrences than the three bear flags and the two tweezer bottoms found here. This site teaches the shape, the rule and what the shape cannot say, and stops there.
Where the broker page fits
The site links to one broker, FxPro, from the button in the header and from the call to action at the foot of each page. The link is an advertising relationship: if a reader opens an account through it, the site is paid. The broker page explains in plain words what a contract on the price of gold is and is not, what is not delivered and what is not paid, and what to read in the terms before an account is opened from Pakistan.
None of the eight pattern pages needs the account: the charts, the rules and the counts for gold futures and the gold fund are on the pages. If a reader does open one, the order ticket asks for a size, a stop and a take profit, which no chart pattern can choose.
Six models, each found on the gold chart
Each card is the stretch of real daily gold prices on which a written rule found the model, drawn from the history this site keeps for Gold (COMEX futures), SPDR Gold Shares (GLD). Open a card for the full chart and the rule.
- Weekend gapSPDR Gold Shares (GLD) · 2 Oct – 1 Dec 2020
- Bear flagSPDR Gold Shares (GLD) · 14 Oct – 10 Dec 2024
- Rectangle rangeGold (COMEX futures) · 24 Aug – 25 Nov 2022
- MarubozuGold (COMEX futures) · 14 Jan – 13 Mar 2020
- Tweezer tops and bottomsSPDR Gold Shares (GLD) · 30 Nov 2017 – 31 Jan 2018
Open an account to act on a pattern
A pattern on a chart is not an order. To place a trade, you need an account with a broker. This site links to FxPro, an international broker that quotes gold as a contract for difference. Opening an account requires identification and takes a day or two.